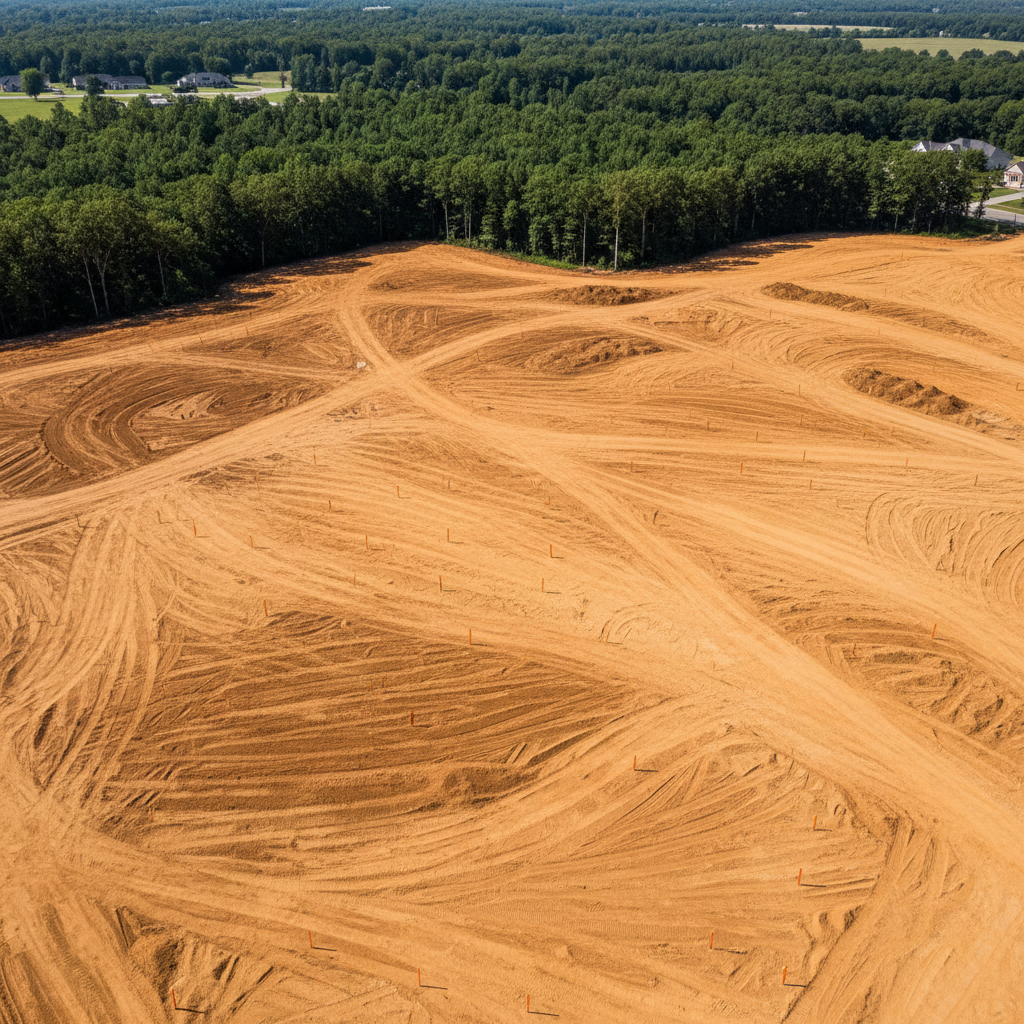
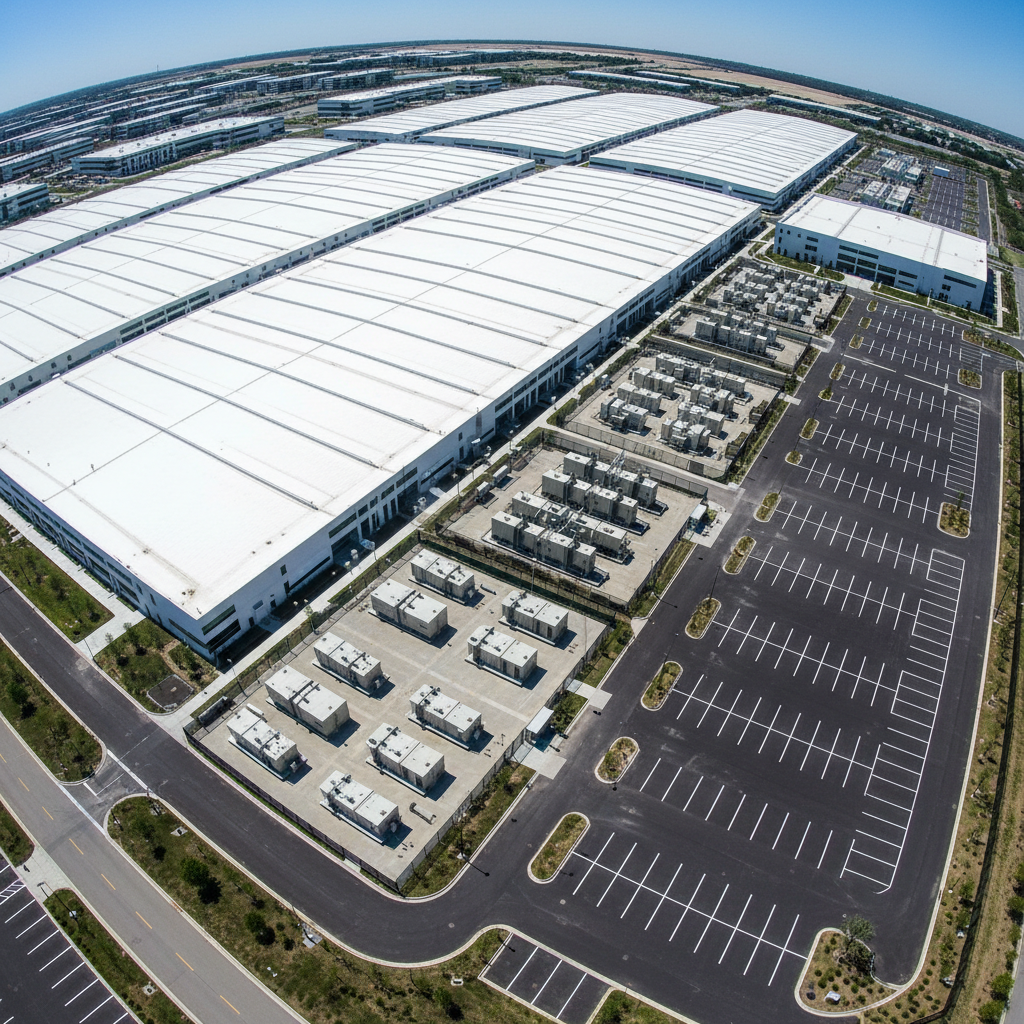
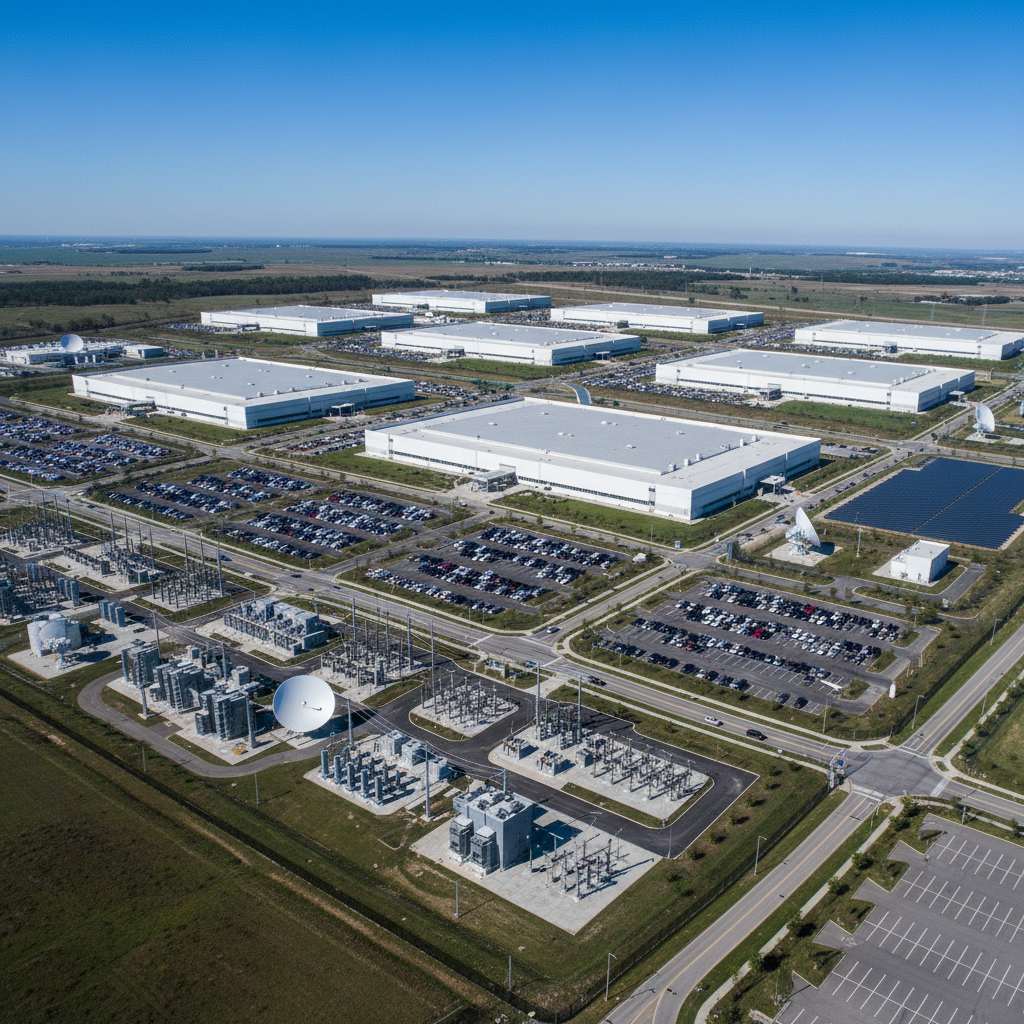
Aerial drone photograph of raw graded earth with orange survey stakes and tree line in background, ready for data center construction
Before — Day 0
Aerial view of completed data center facility with white rooftops gleaming, generator yards fenced, parking lot striped, showing finished construction
After — Power-On Day

From Dirt to Data.

On Schedule or We Pay.

Drag to see the transformation · 50% revealed

Scroll
$258BGlobal DC Construction Market 2025
94.7%Vault On-Time Delivery Rate
100 GWNew Capacity 2026–2030
49 SitesVault Projects Delivered
$10.7MAvg Cost Per MW (2025)
16 mo.Vault Avg Interconnect Lead
$4.2BPE Capital Supported
56%Tier III Market Share 2025
270 GWPJM Queue Backlog
0.3%Avg GMP Variance
$258BGlobal DC Construction Market 2025
94.7%Vault On-Time Delivery Rate
100 GWNew Capacity 2026–2030
49 SitesVault Projects Delivered
$10.7MAvg Cost Per MW (2025)
16 mo.Vault Avg Interconnect Lead
$4.2BPE Capital Supported
56%Tier III Market Share 2025
270 GWPJM Queue Backlog
0.3%Avg GMP Variance
§ The Vault Guarantee Framework

Six Promises.
Six Receipts.

Every claim is backed by a document you can read, a number you can verify, and a penalty clause you can enforce.

CLAIM — Vault Commitment
PROOF — Supporting Evidence
01

Schedule Adherence

LD Schedule Binding

Liquidated damages of $150K/day for every calendar day past the contracted power-on date. No carve-outs for supply chain. No force majeure on equipment we should have procured 18 months early.

Data center construction site with tower cranes and steel structure rising from concrete foundation at dusk
On-Time Delivery Rate
94.7%

47 of 49 projects delivered on or before contracted date · 2019–2025

02

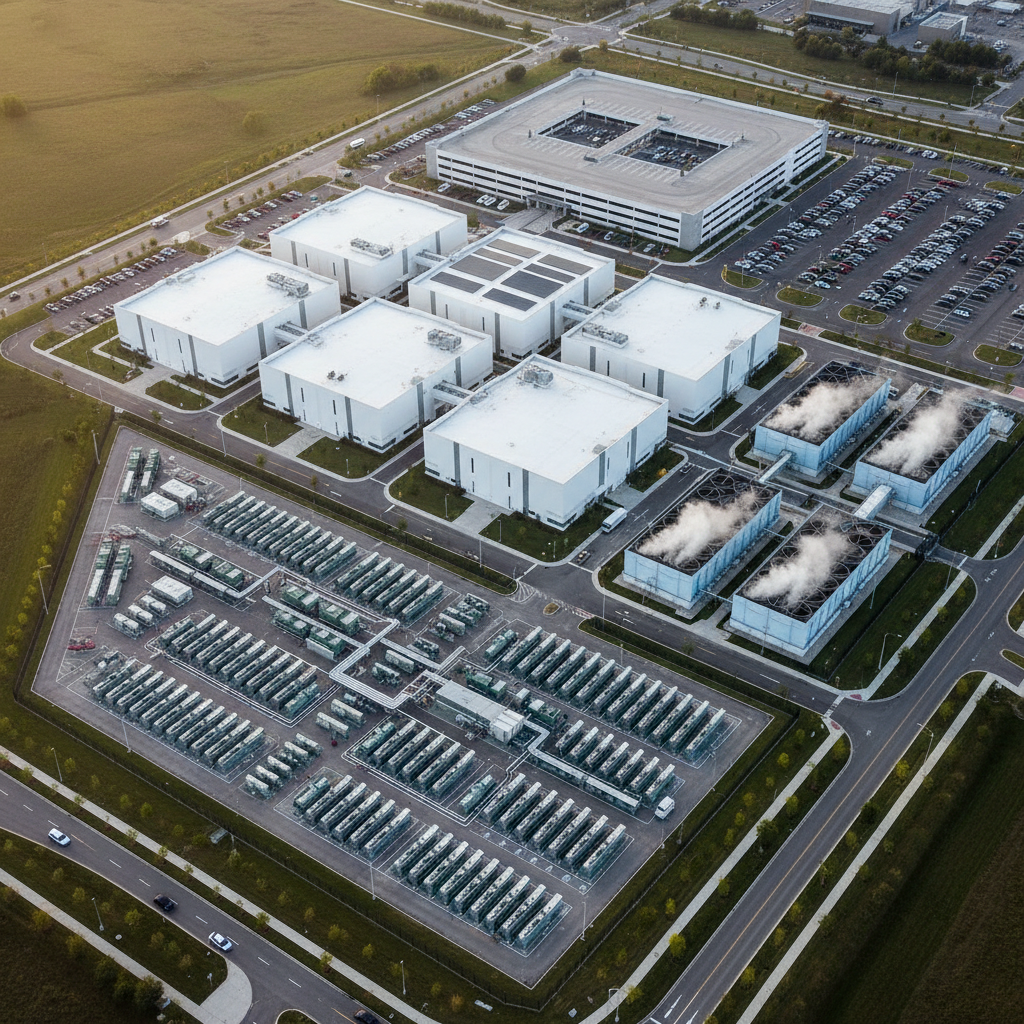
Tier III Uptime-Ready

Uptime Institute Certified

Every facility ships certified Tier III concurrent-maintainability ready from day one. We commission with the Uptime Institute on-site, not after the fact. N+1 mechanical, 2N power path, 99.982% uptime SLA.

Interior of completed data center with server racks in rows, overhead cable trays, and cooling infrastructure visible
Commissioning Certificate
UI-2025-0847

Uptime Institute Tier III COD · Columbus, OH Campus · 48 MW

03

Sealed-Envelope Pricing

Zero Overrun Guarantee

GMP contract with a locked cost envelope. Change orders require mutual written agreement. Our last 12 hyperscale projects averaged 0.3% variance from GMP — not because we got lucky, but because we front-load the estimating.

Aerial view of completed data center campus with generator yard, cooling towers, and parking infrastructure
Change Order Log — Redacted
+0.3% avg

Composite variance across 12 hyperscale projects · 2022–2025 · Available under NDA

04

Cooling System Delivery

Integrators Pre-Contracted

Air, liquid, or hybrid — we have integrators under contract before we break ground. In 2025, two-thirds of contractors struggled to source direct-to-chip loop technicians. We secured our cooling partners 24 months ahead of the market.

Large industrial cooling towers and mechanical equipment yard at an operational data center facility
Cooling Deployments
23 Sites

9 direct-to-chip · 8 air-side economizer · 6 hybrid liquid · All commissioned on schedule

05

Utility Interconnection

14 Active Utility Markets

PJM queue times hit 270 GW in 2025. We have pre-negotiated utility relationships in 14 markets and a dedicated interconnection team that has never missed a utility RFP window. Power delivery is our problem, not yours.

High voltage electrical substation with transformer banks and transmission lines at a data center power delivery point
Average Interconnect Lead
16 mo.

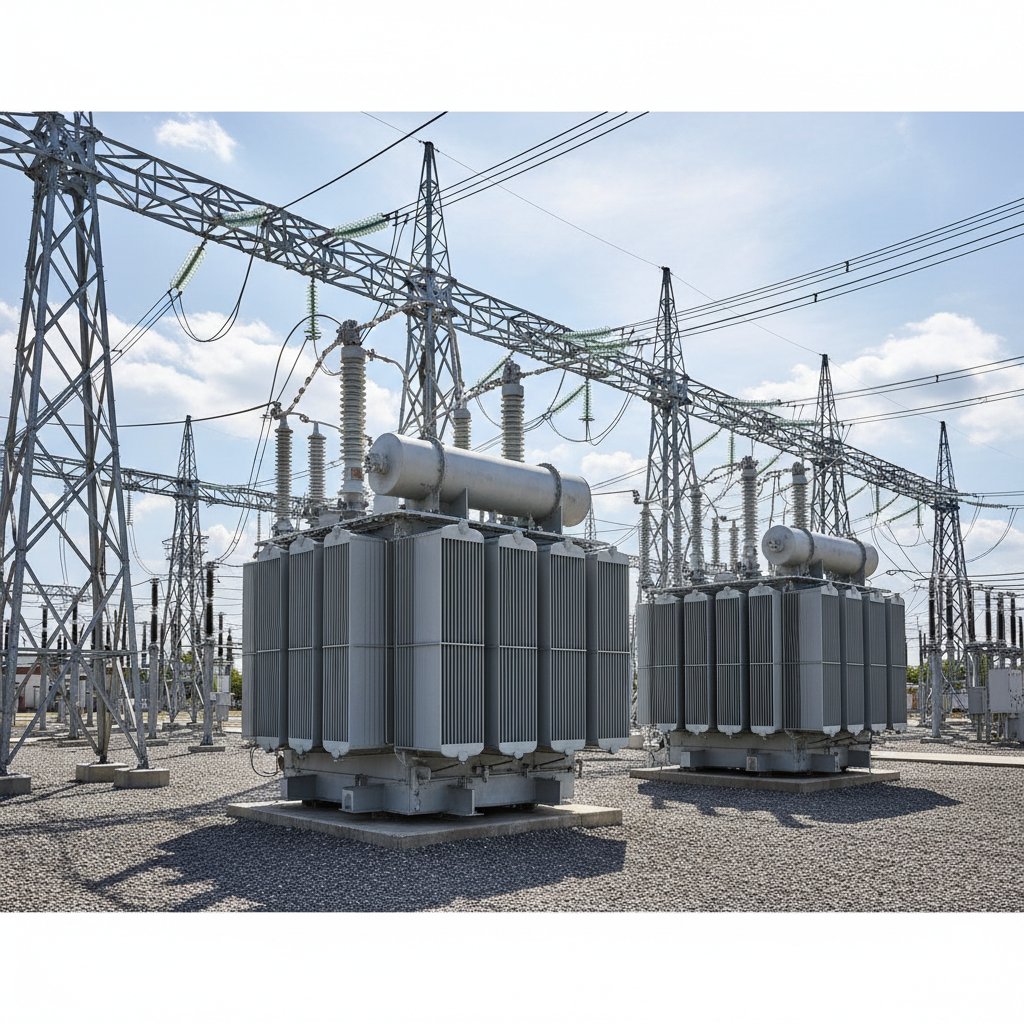
vs. 28-month industry average · Confirmed across 31 utility interconnection agreements

06

Private Equity Reporting

$4.2B PE Projects Delivered

Monthly draw schedules, certified cost-to-complete reports, and a real-time construction dashboard accessible to your investment committee. We've supported $4.2B in PE-backed digital infrastructure underwriting since 2021.

Aerial photograph of large data center campus under construction showing multiple building phases and site infrastructure
PE Capital Deployed
$4.2B

Across 14 PE-backed campus builds · KKR, Blackstone, and Brookfield supply chain partners

§ Primary Conversion Path

Score Your Build Readiness

Five questions. Two minutes. A preliminary feasibility snapshot and a calendared call with a preconstruction director.

Build Readiness Score0%
Step 1 of 5

Planned MW Capacity

IT load at full build-out

§ Book the First Call

Ready to Pour
the First Slab?

A 45-minute call with a Vault preconstruction director. We'll review your site, schedule, and capacity targets — and tell you exactly where the risk is.

No pitch deck. Just your project and our numbers.
Preliminary schedule assessment within 5 business days.
GMP framework delivered before we ask for a contract.
Score Your Build Readiness
Vault Construction Group · 2025

The Vault Guarantee Framework

LD Schedule · GMP Pricing · Tier III Cert · Cooling SLA

24
Pages
PDF
Format
2025.2
Version

Download our full guarantee framework — the same document we hand to investment committees. Enter your work email and it arrives instantly.

No spam · Unsubscribe any time · Your data stays with Vault

49
Facilities Delivered
14
Active Utility Markets
$4.2B
PE Capital Supported
0.3%
Avg GMP Variance
94.7%
On-Time Rate